

Where DNA Becomes Art: Visualizing the Code That Connects All Living Things
April 27, 2026
At LSU’s School of Art in the College of Art and Design, professor Courtney Barr is turning complex genetic data into something unexpectedly human: visual art.
As a graphic designer and researcher, she transforms dense DNA code into compelling imagery that helps people see—and feel—the connections between species, generations, and ourselves.
“It’s a visual language that we all share,” she said. “It’s all within us.”
We asked Barr to tell us about her work. Answers have been edited for clarity and length.
Tell us about yourself.
I'm the Associate Director of the School of Art, and I'm also a professor in the graphic design area of the school. In my research, I work with infographics that explain complex visual information. My primary area of research is DNA and visualizing genetic information.
How did you develop an interest in genetics?

Courtney Barr
I got interested in genetic information as a sort of family genealogist, dealing with my own family tree and finding interesting ways of mapping out genealogical connections between all of my relatives, and mapping out my family history.
Then I discovered that you could download your own DNA from Ancestry.com or 23andMe; they all share their DNA data with you. It just comes as a giant spreadsheet full of thousands of letters, and trying to figure out what all that means has been a really interesting journey.
My goal was to take all that complex information and make it more visually interesting, visually appealing to a non-scientific audience, or maybe an audience who isn't maybe as comfortable with really dense scientific information. So, my approach to my work is to make people have more of an emotional connection with it and see how we are all tied together by this data.
What should we know about DNA?
DNA is the basic building block of what makes living things what they are. And it's also one of the most recognized scientific concepts or diagrams that crosses many kinds of people and age ranges. Everyone recognizes DNA because it's become part of pop culture, movies, and our culture. So, DNA is something that we recognize on a surface level. What makes it interesting to me is that it ties us all together as living species. It also helps us understand species that are no longer here.
How did you come to see DNA as a potential work of art?
I started by mapping my own DNA and comparing it to that of my mother and my grandmother. It’s spreadsheets of thousands and thousands of letters, but when you visually overlap those collections of letters, you start to see where we share similarities and differences.
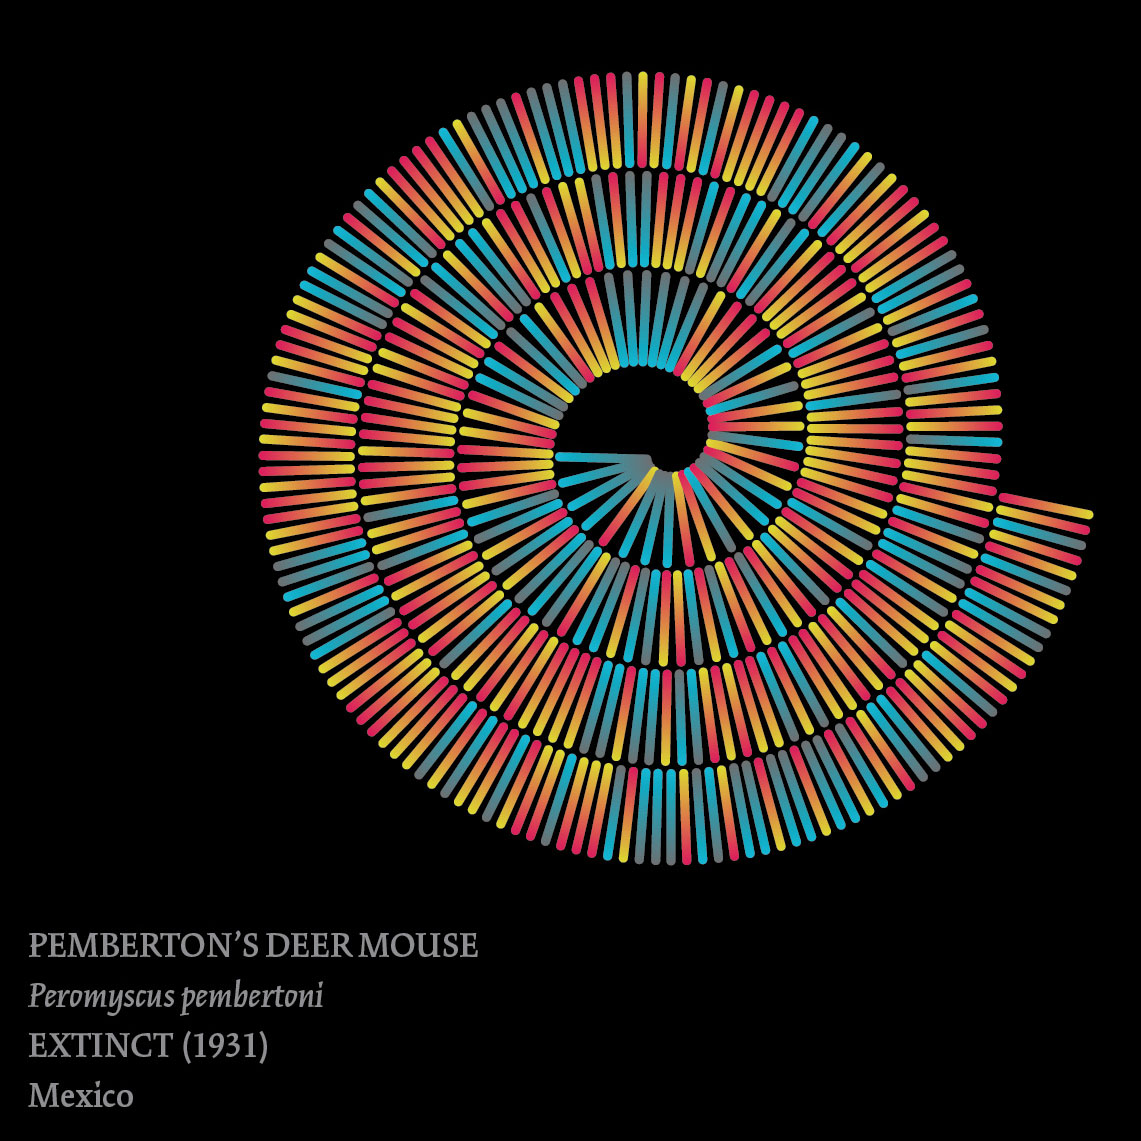
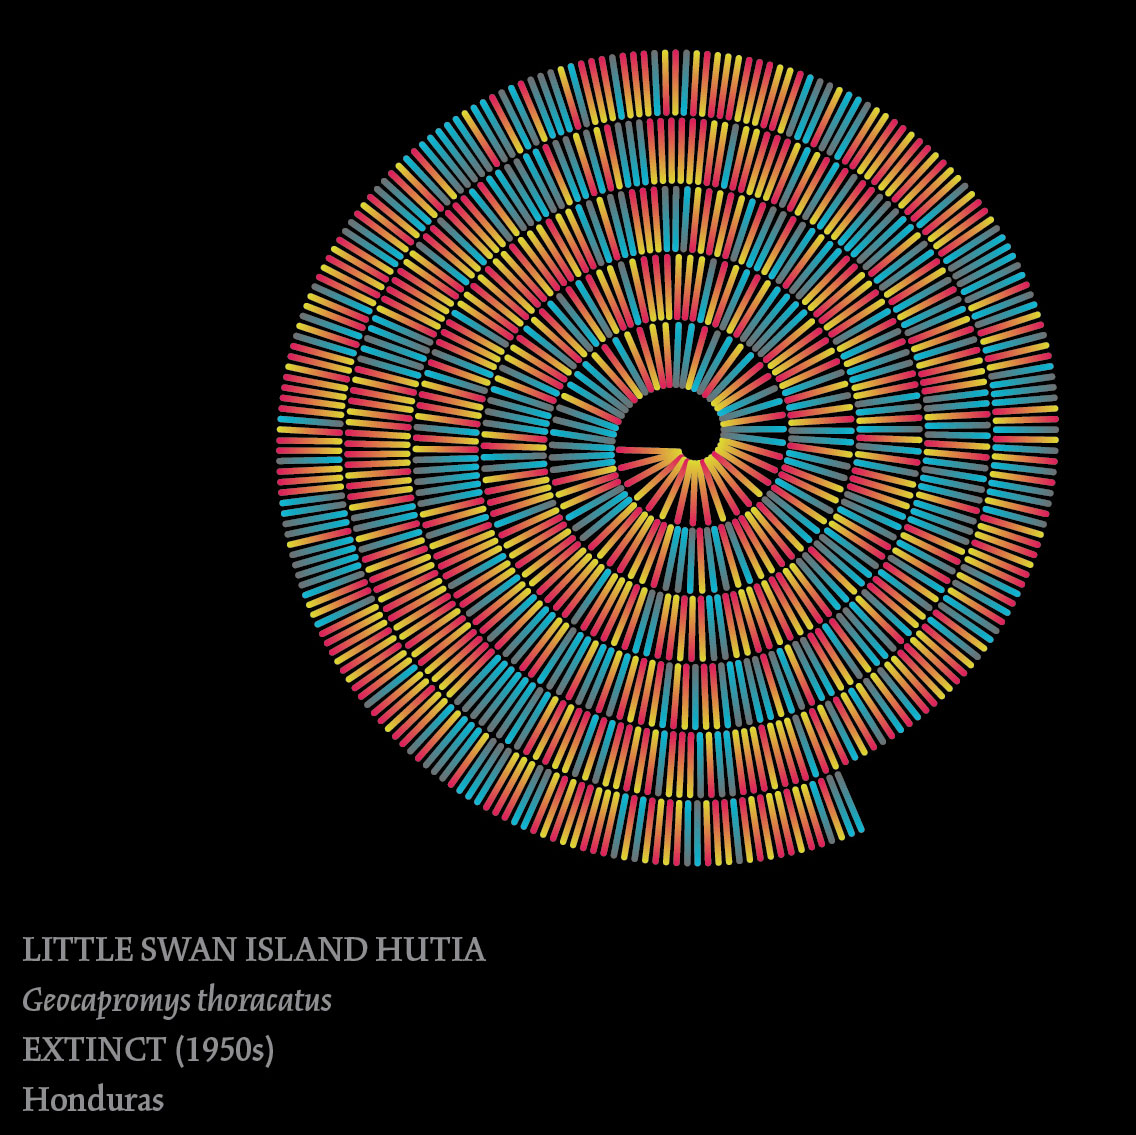
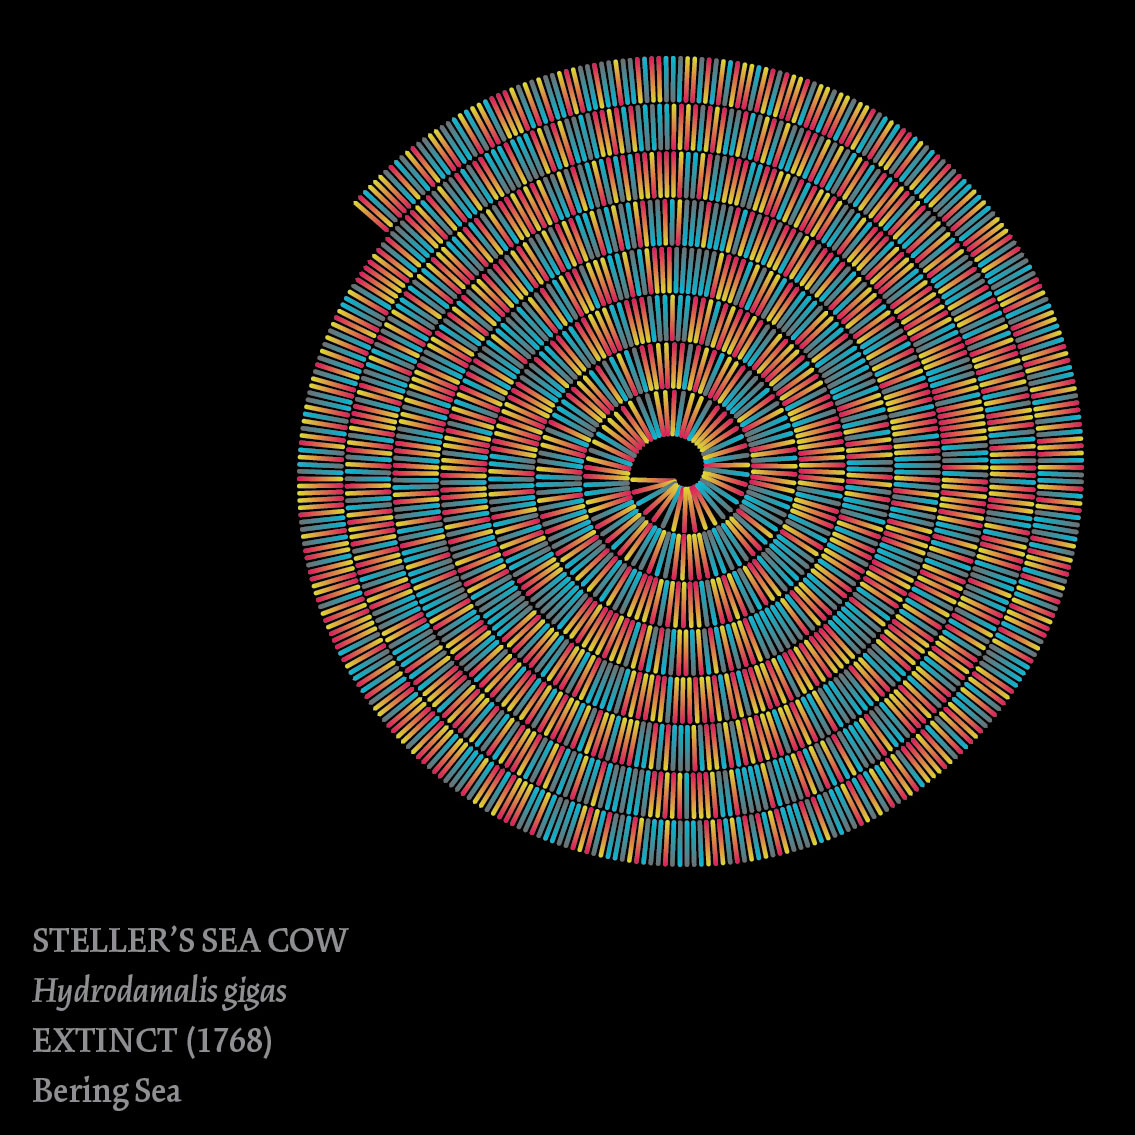
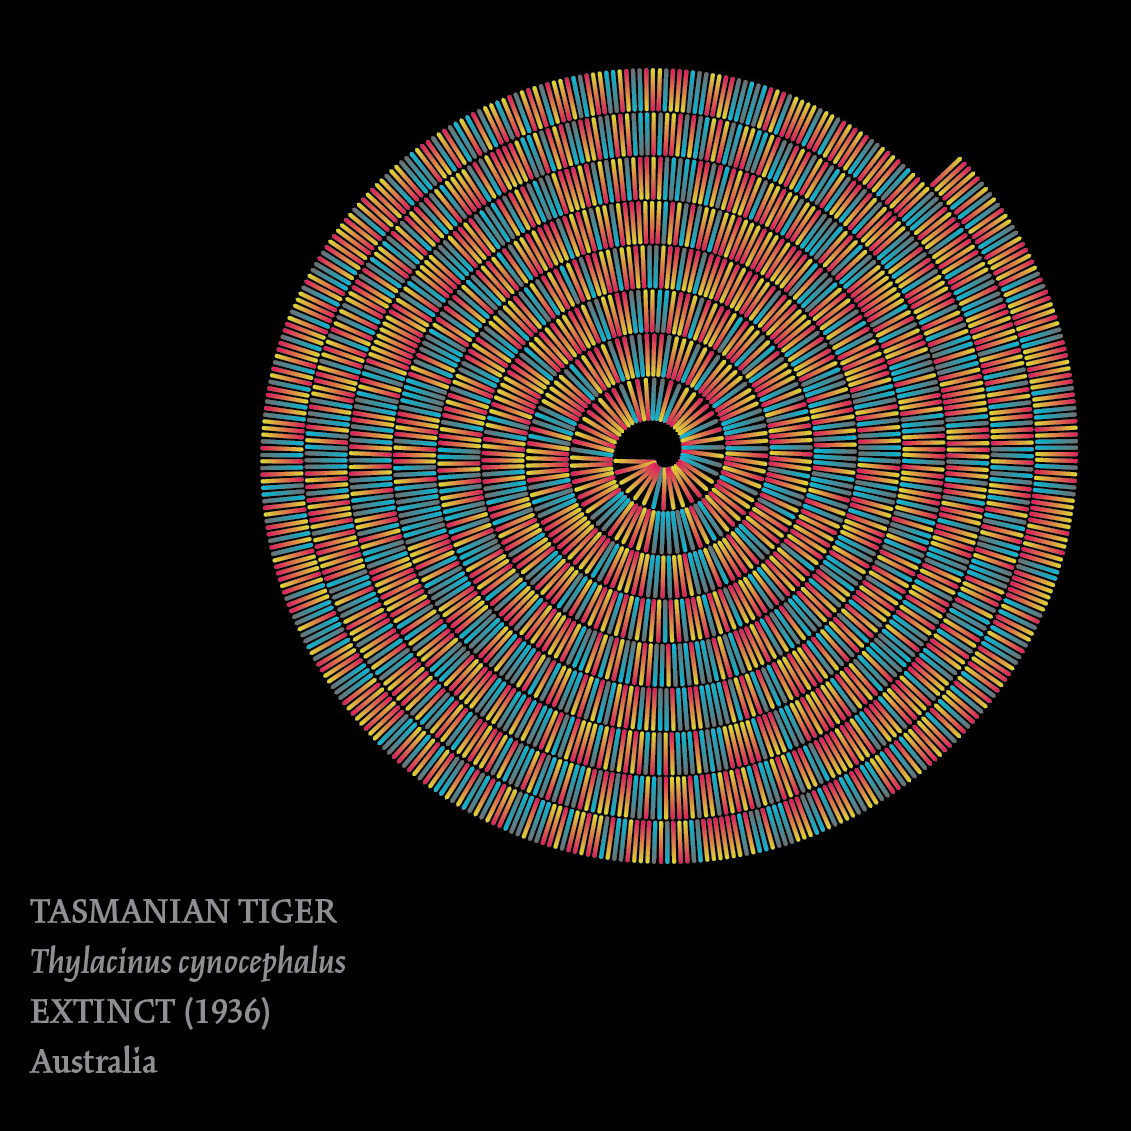
So that was interesting to me to be able to make that visual comparison. Moving from human DNA, I started to look at DNA barcoding, which is an open-source database of species focusing specifically on extinct species.
That led me to explore various ways to show what these species have in common. It's just a way to highlight the uniqueness of extinct species and highlight the fact that all we really have left of these species is the DNA data they've left behind.
Tell us about your process.
With these pieces, I am using DNA barcodes, short snippets of genetic information that have been identified by scientists to represent this specific species. In this particular series, I'm taking the barcode of the animal and visualizing it by converting the A, C, T, and G “letters” of the DNA into a symbol system.
I have a color-coded symbol that replaces the letter form, so I can create a visual design that's less dependent on the letter forms and more reliant on a more visually compelling series of symbols to represent the species.
One of my first experiments was to just visualize my own Chromosome 1, which, when converted into a symbol system, filled up an entire wall. That's when I realized a more efficient system needed to be created. And I came up with the concept of changing the letter forms into more compact symbols in a circular or spiral format.
Then you can look at bird species side by side and see where they share common genetic markers. That's the point of that spiral format, which allows me to keep them aligned, but also evokes the sense of flight or wing.
How would you like people to experience your work?
When people are looking at my work, I hope they walk away with a better understanding and a higher level of interest in understanding genetic information. I think it may seem sort of dense in terms of its complexity, but with my work, I'm hoping that I can bring that density down to a more accessible level.
Genetic information is shared across not only human beings—related individuals like mother to grandmother—but also across species or across individuals within a species. It's a visual language that we all share. It's all within us, and that's the beauty and the simplicity of it.